Uptime Kuma Changed How I Monitor Everything
How a self-hosted uptime monitor with Telegram alerts replaced the need to constantly check on client services. Simple setup, immediate value.
The Stack Grew, Monitoring Didn’t
At some point last year, I looked at what I was actually running — Exlink servers, Dadooo.ai, my Mailcow mail server, Nextcloud, Gitea, Jellyfin, client websites and realized the application stack had quietly scaled past the point where manual checking made sense. There was no single event that triggered it. The number of services just kept growing, and I needed proper monitoring to keep up.
Why Not Datadog or New Relic
For large-scale production applications with complex metrics, distributed tracing, and APM? Sure, reach for Datadog or New Relic. But most of what I need to know is binary: is it up or is it down?
I don’t need per-request latency percentiles for my Jellyfin server. I don’t need distributed traces for a Mailcow instance. I need to know the moment it stops responding so I can fix it before anyone else notices.
Uptime Kuma is exactly that. Self-hosted, zero cost, minimal resource usage. It runs on a Docker container in my Proxmox homelab and checks every service I care about every 60 seconds.
The Setup
Installation was a single Docker container. The configuration is entirely through a web UI — add a monitor, specify the URL or IP, pick the check interval. Done.
The real value came from two features:
Telegram notifications. Every monitor is wired to a Telegram bot. Service goes down: notification on my phone within a minute. Service comes back. Another notification confirming recovery. I went from finding out about outages hours later to knowing within 60 seconds.
Public status pages. For clients who want visibility into their services, I create a public status page showing uptime for their website, mail server, or any other service I manage. They can check availability themselves without opening a ticket. It builds trust. Transparency about uptime is better than promises about uptime.
What It Actually Caught
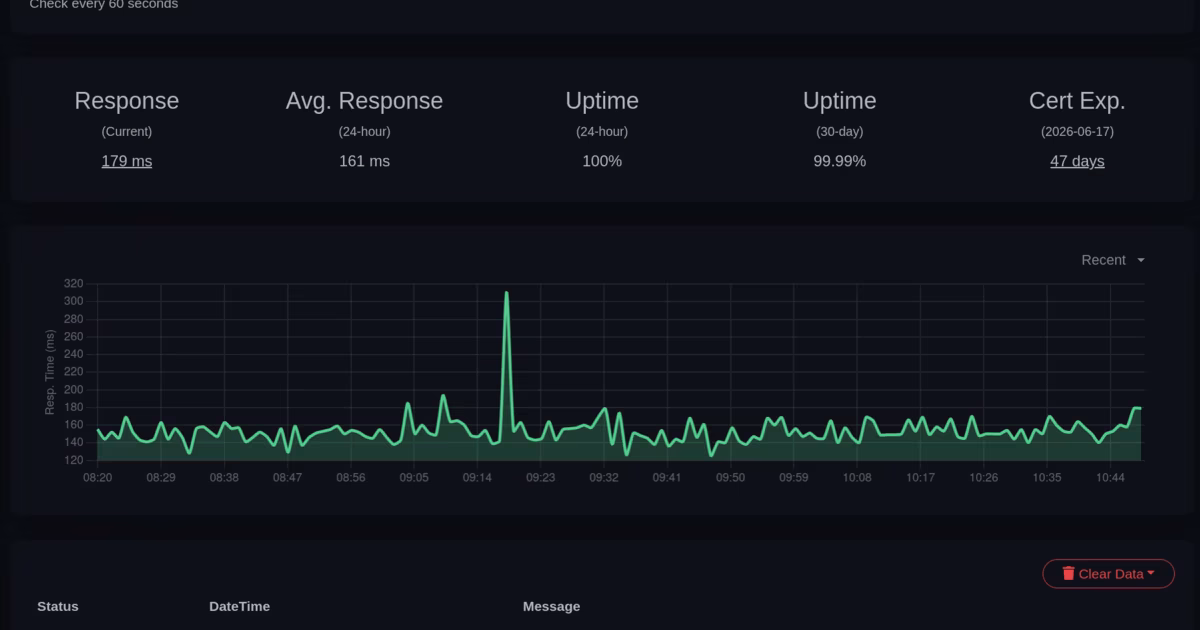
That’s Dadooo.ai being monitored — 99.99% uptime over 30 days, average response time around 160ms, and one brief DNS resolution hiccup on April 2nd that resolved in two minutes. Without Uptime Kuma, I wouldn’t have known about that DNS blip until it either resolved itself or a user complained.
The certificate expiration tracking is a quiet win too. 47 days until the cert expires — I’ll get notified well before it becomes a problem. No more scrambling to renew certificates that silently expired over a weekend.
The Pattern
This fits the same pattern as most of my self-hosted infrastructure. The setup cost is an hour or two. The ongoing maintenance is essentially zero. And the alternative, whether paying for an enterprise monitoring tool or just not monitoring, is worse in every way.
Uptime Kuma won’t replace proper observability for complex systems. But for the 90% of services that just need an “is it alive” check with instant notifications, it’s the best tool I’ve found. Simple problem, simple solution, immediate value.
Written by
Peter KnausFounder of KnausDev. I build backend systems, AI pipelines, and enterprise platforms.